State Appropriations at the UO
State appropriations play a foundational role in the University of Oregon’s ability to provide an accessible, high-quality education, conduct groundbreaking research, and serve communities across the state. However, Oregon’s investment in higher education falls far short of what’s needed to support its public universities, forcing institutions like the UO to rely heavily on tuition revenue to cover operating costs.
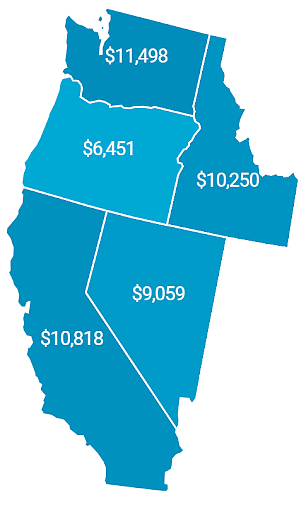
Decades of state underinvestment have left Oregon’s public universities among the lowest-funded in the nation on a per-student basis. Compared to the national average, Oregon provides just 63% as much funding per full-time equivalent student to its public four-year universities. Neighboring states like Washington and California invest significantly more, allowing their public universities to keep tuition rates lower and maintain greater access for students.
Within Oregon, the University of Oregon receives the lowest level of state appropriations per resident student of all public universities, increasing the reliance on tuition to cover operating costs.
How State Funding Works
The University of Oregon receives state funding through several key mechanisms:
- Public University Support Fund: The primary fund for state support of operational expenses to all seven of Oregon’s public universities, distributed through a formula based on state priorities.
- Bonding for Capital Construction Projects: Through bonding capacity, the state allocates targeted funds to universities to maintain and renovate public buildings on campus and build new construction.
- State Programs: Allocations for specific university programs and activities that align with state priorities.
- Direct Appropriations: Oregon provides funding for other specific programs and activities at universities through either one-time or ongoing allocations.
The State Funding Gap
The State of Oregon continues to provide far less funding per full-time equivalent student to its public universities than neighboring states and the national average. This funding gap forces public universities to rely more heavily on tuition revenue to maintain operations and provide a high-quality education for students, shifting the cost burden onto students and families.
Quick Facts:
- Compared to their peers in neighboring states, Oregon’s public universities operate with far less state funding per student.
Public Higher Education Appropriations per FTE by State at Four-Year Institutions, FY 2023 (Adjusted for COLI, HECA)
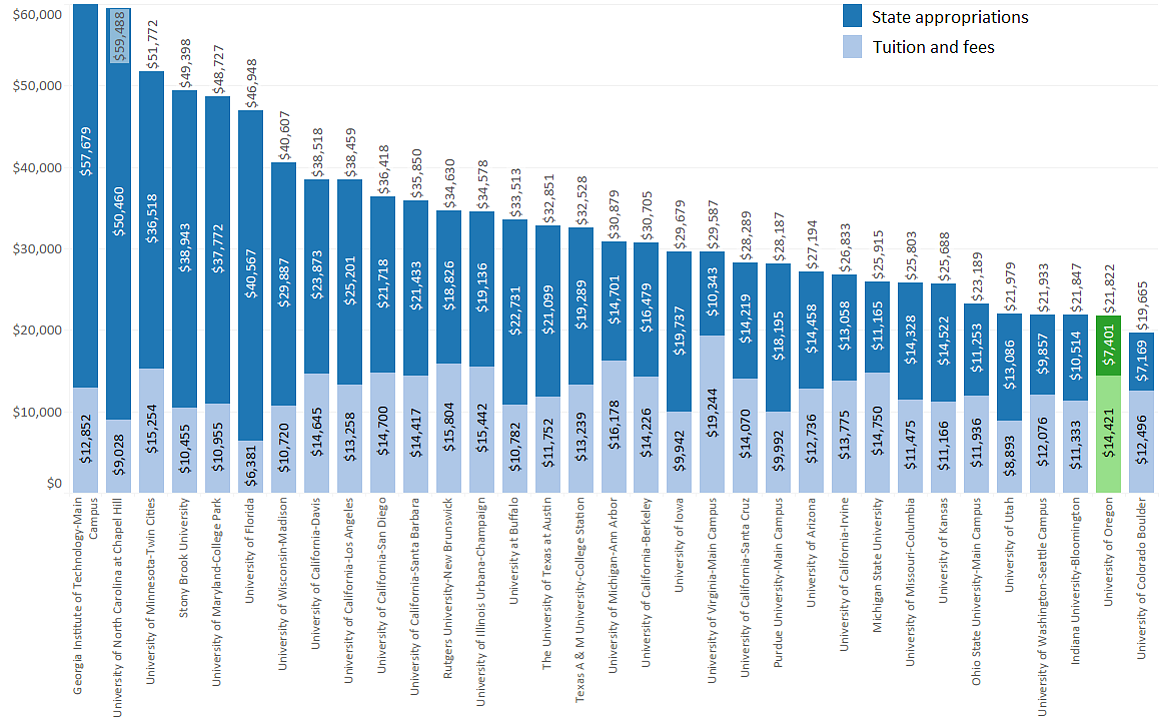
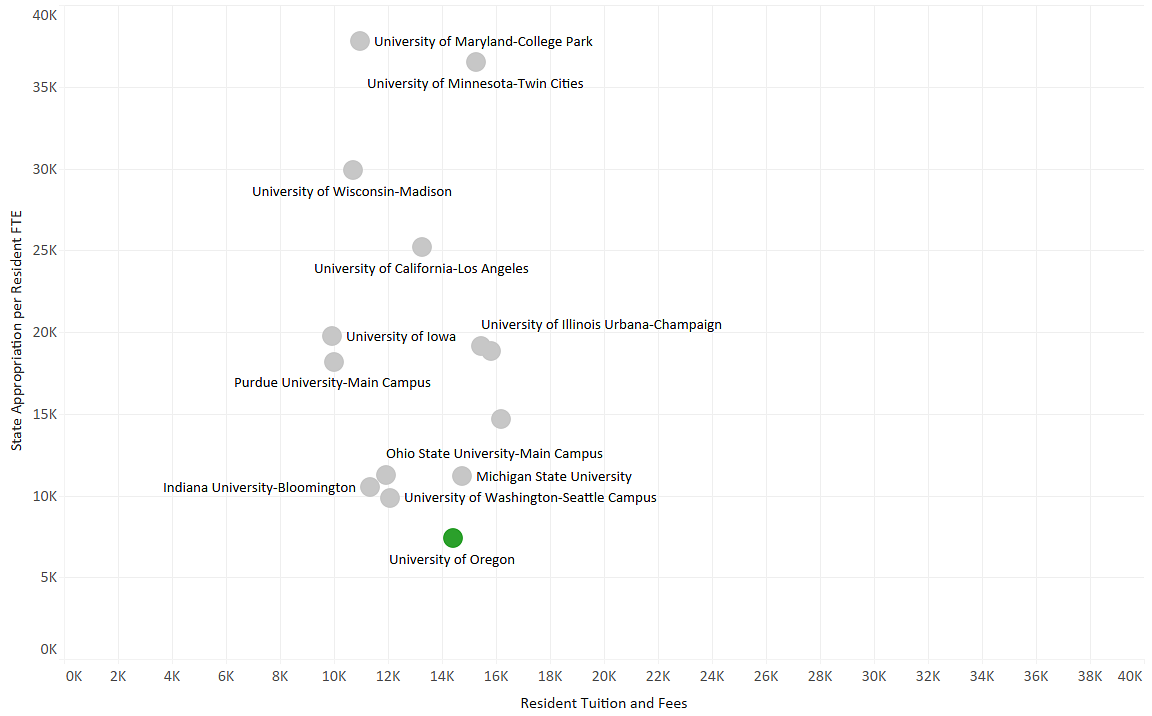
- Even when combining state funding and tuition, the UO receives less revenue per student overall than most comparable institutions.
State Appropriation per Resident Student and Resident Tuition and Fees among AAU Publics (FY2022) (bar chart)
- Within Oregon, the UO receives the lowest state appropriations per resident student of any public university, which intensifies the reliance on tuition revenue.
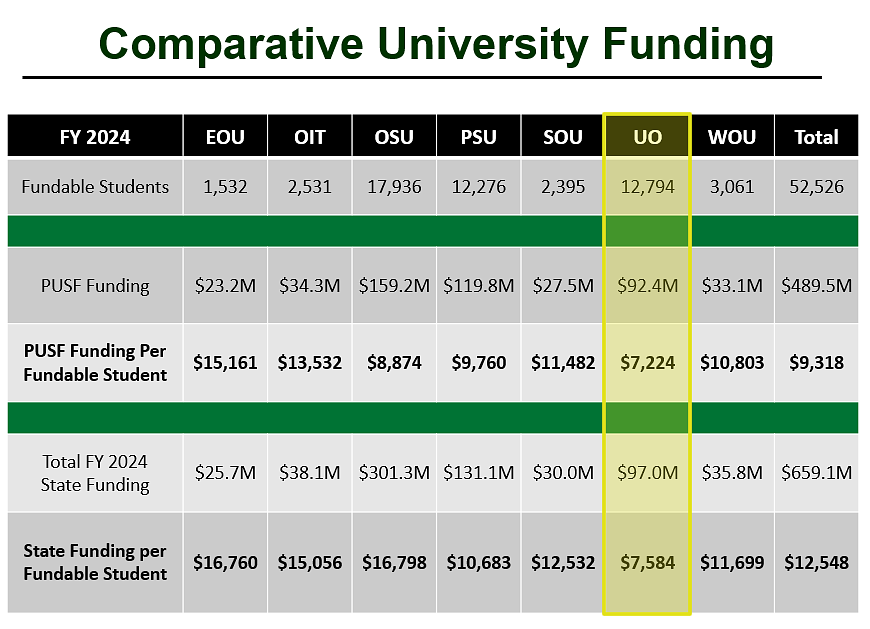
This dynamic increases the financial burden on students and limits the resources available to invest in programs and services that support student success.
While it’s true that state support and tuition revenue have increased over the past decade, these increases haven’t kept pace with the rapidly rising costs of providing a world-class education. Personnel costs, including salaries, benefits, and PERS, have grown significantly, as have institutional expenses such as insurance and utilities, and necessary investments in facilities, technology, and student support services. All these factors must be considered when assessing the university’s overall financial health in a national climate with considerable economic challenges for higher education.
What’s in the Governor’s Recommended Budget?
The Governor’s Recommended Budget (GRB) for 2025-27 proposes $1,068.8 million for the Public University Support Fund for distribution to Oregon’s seven public universities. This funding level represents just a 2.8% increase for FY2026 compared to FY2025—a marginal increase that does not keep pace with the rising costs of operating public universities.
For the University of Oregon, this funding level falls far short of what’s needed to maintain even the state’s already very low share of the university’s Education & General (E&G) fund budget. The Higher Education Coordinating Commission (HECC) has cautioned that funding at this level would have serious implications for Oregon’s public universities, including tuition increases, reductions in services, and threats to institutional stability.
Why This Matters for Students and Families
State underfunding places a greater financial burden on students and families by increasing reliance on tuition increases to maintain university operations. This dynamic directly impacts the affordability of a public university education as well as the ability of universities to sustain critical programs and services that support student success.
Significantly increased state support would enable the University of Oregon to reduce its reliance on tuition to maintain operations, supporting broader access to the high-quality education and vital services that help students succeed.
Get Involved
If you are interested in joining efforts to increase funding for higher education in Oregon, please reach out to either your ASUO representatives or one of the TFAB representatives who can help connect you with legislative staff working on this issue.
Students, faculty, staff, alumni, and anyone else interested in supporting increased state funding for higher education can join the UO Advocates program. Advocacy efforts help ensure legislators understand the critical role public universities play in the state’s future. Join UO Advocates.
State Appropriation in Actual and CPI-adjusted Dollars, FY90 to FY24
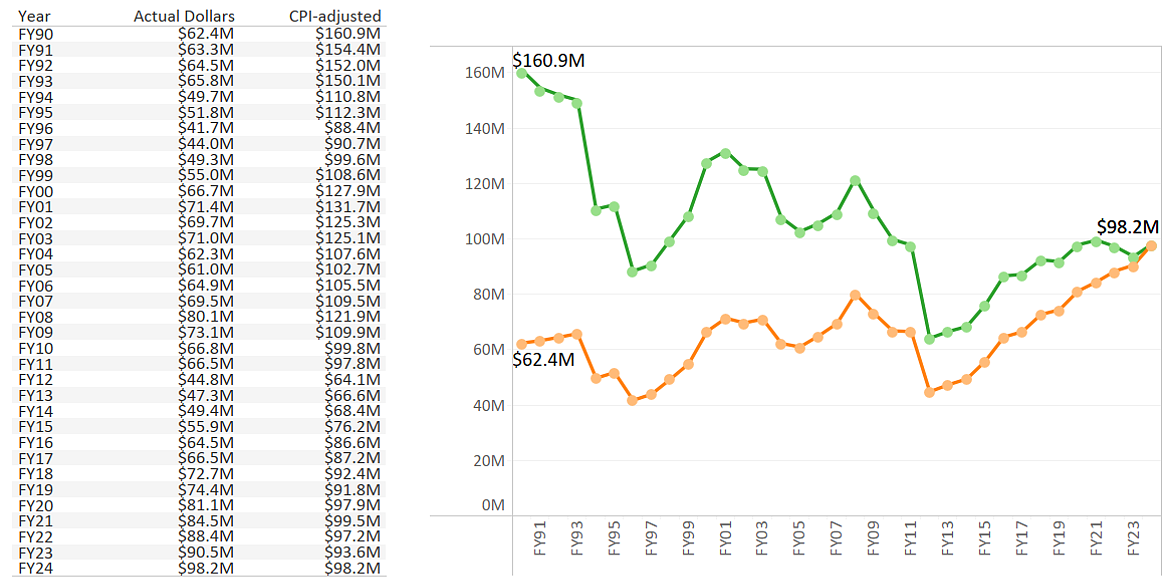
Source: UO Office of Institutional Research.
State Appropriation and Resident Tuition (net: after remissions) Revenue per Student FTE FY99-FY24
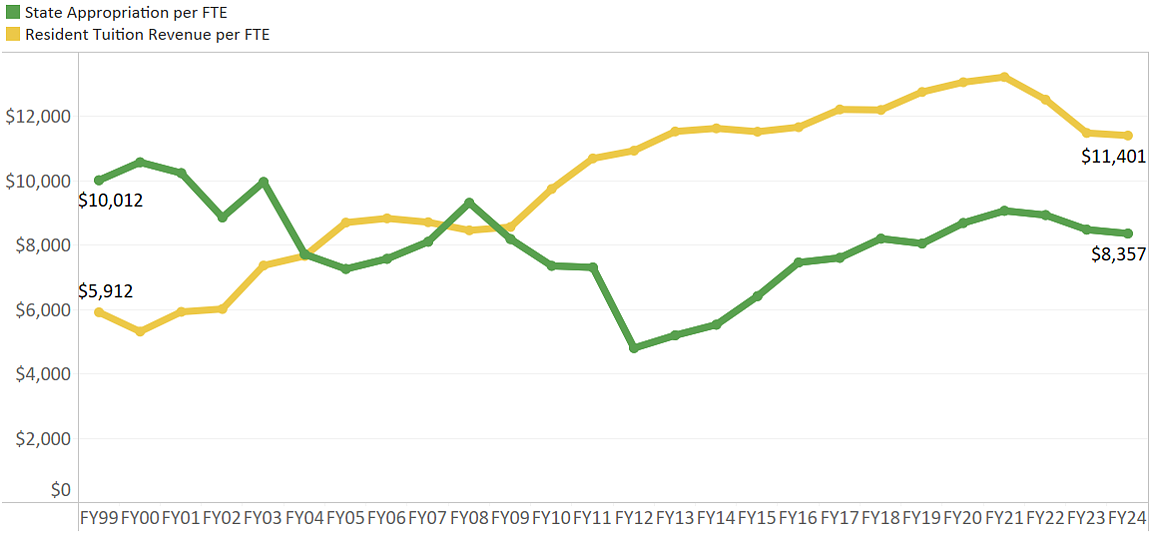
Source: UO Office of Institutional Research.
State Appropriation and Resident and Nonresident Tuition (net: after remissions) Revenue per Student FTE FY99-FY24
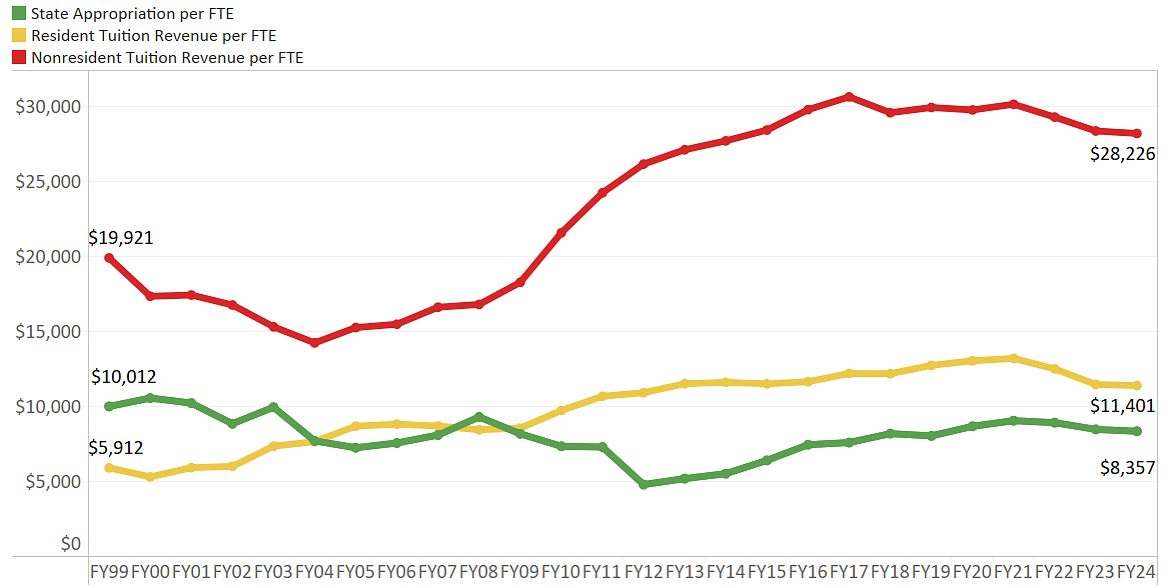
Source: UO Office of Institutional Research.
State Appropriation per Resident Student and Resident Tuition and Fees among AAU Publics (FY2022) (scatter plot)

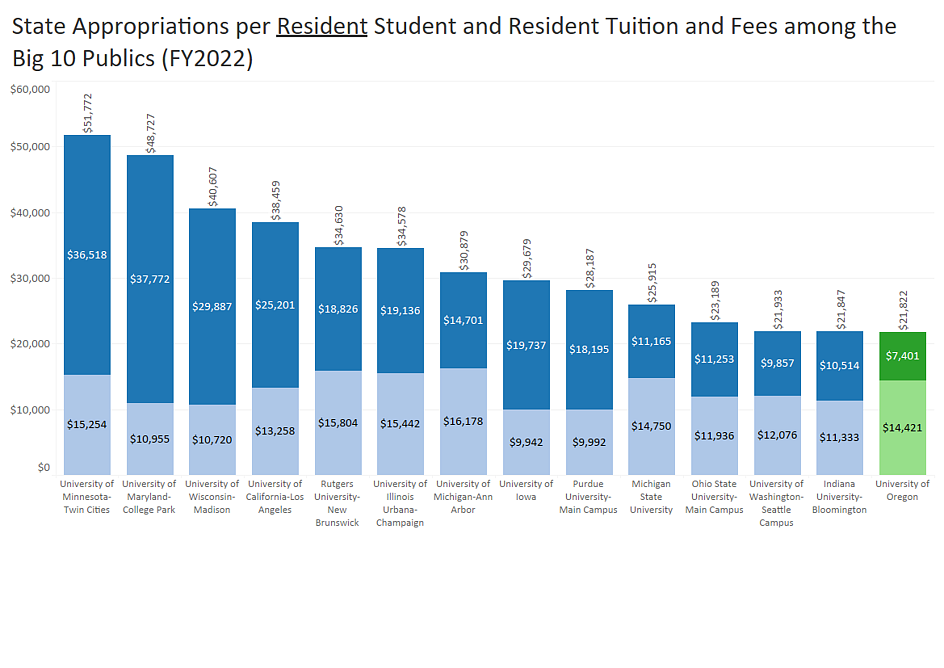
State Appropriations per Resident Student and Resident Tuition and Fees among Big 10 Publics (FY2022) - scatter plot
State Appropriations per Resident Student and Resident Tuition and Fees among Big 10 Publics (FY2022) - bar graph